
-
Land block details

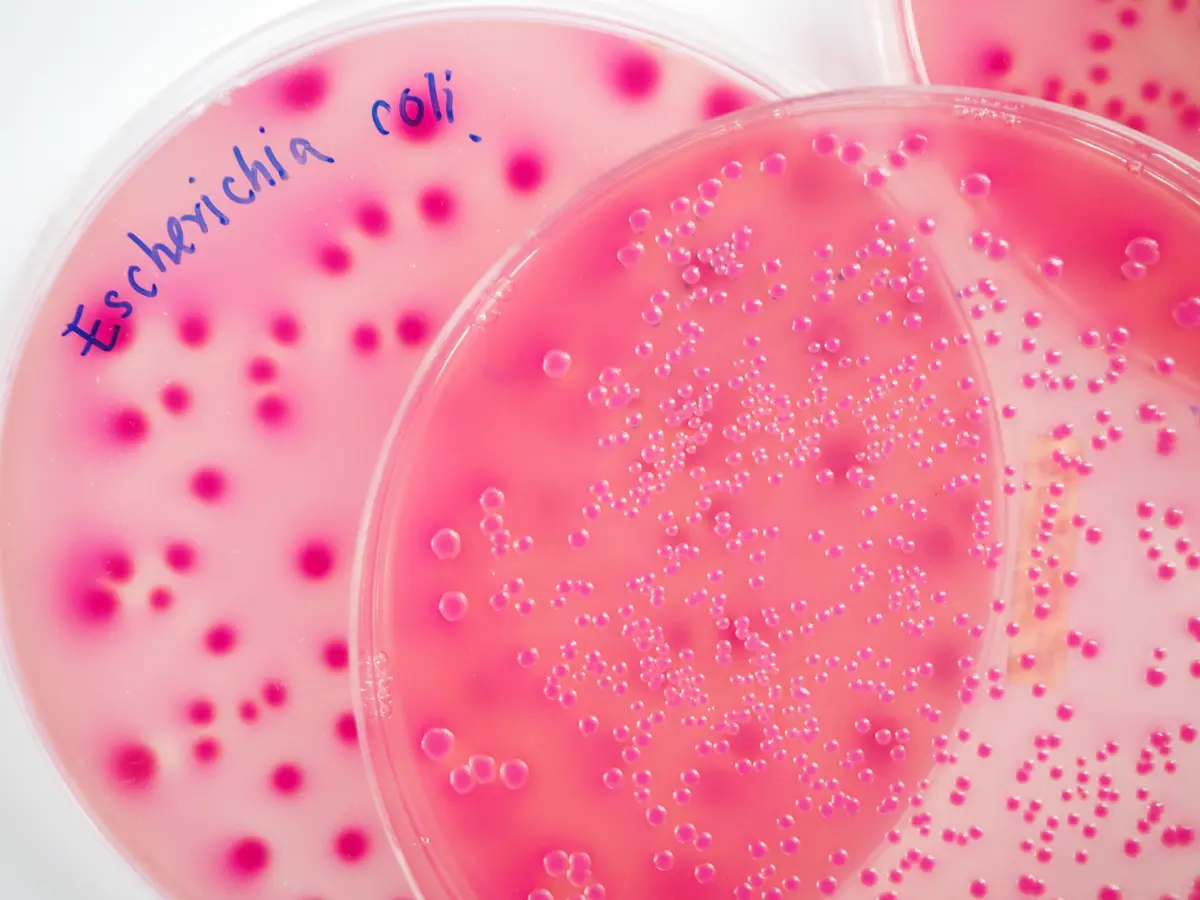
Current state vs freshwater objectives: E. coli
-
Escherichia coli (E. coli) enters our waterways through animal waste contamination. It is a human health issue that can limit swimming areas and mahinga kai practices as it can cause severe illness. Of the water contaminants of nitrogen, phosphorus, sediment and E. coli, E. coli requires the most reduction.
The dataset - what is it?
E. coli is estimated in its current state and shown as
- local excess loads;
- regional and national load reduction required; and
- most problematic catchments.
Maps and tables by region show the reduction required to the current levels of E.coli in water catchments to meet minimum standards. This is up to an average of 91% in Waikato and 19% on the West Coast.
Why it's important
E. coli loads need to be reduced in catchments comprising 79% of the land area of New Zealand. Land use hosting warm-blooded animals requires containment planning. In areas requiring the greatest reduction alternative land uses may be required.
-
-
How to use this information safely
-
Fitness for purpose / limitations
This table indicates whether the dataset is suitable for different types of questions at different scales.
Note: Users should carefully consider their purpose as this dataset may not be suitable.
Operational
Absolute
Relative
Screening/scoping
Block/farm
No
No
No
No
Multi-farms(5+)
No
No
No
No
Catchment
Maybe
Maybe
Maybe
Maybe
National/regional
Yes
Yes
Yes
Yes
Caveats
The study has used all the available data. Therefore, it would be difficult in most catchments to improve on the analysis. However, because the models were all national in extent, there may be a degree of model bias when the results are applied at fine scales.
-
-
-
Please note:
You can use this information to help form an understanding of E. coli pressures across Aotearoa.
Your PDF will download to this device shortly. It can take up to a minute on a slow connection. Please do not close your browser.
Locate and explore different uses for your whenua
Tell us a bit about your whenua and priorities you and your whānau hold. Our tool will present some different uses for your whenua that may help you achieve these.