


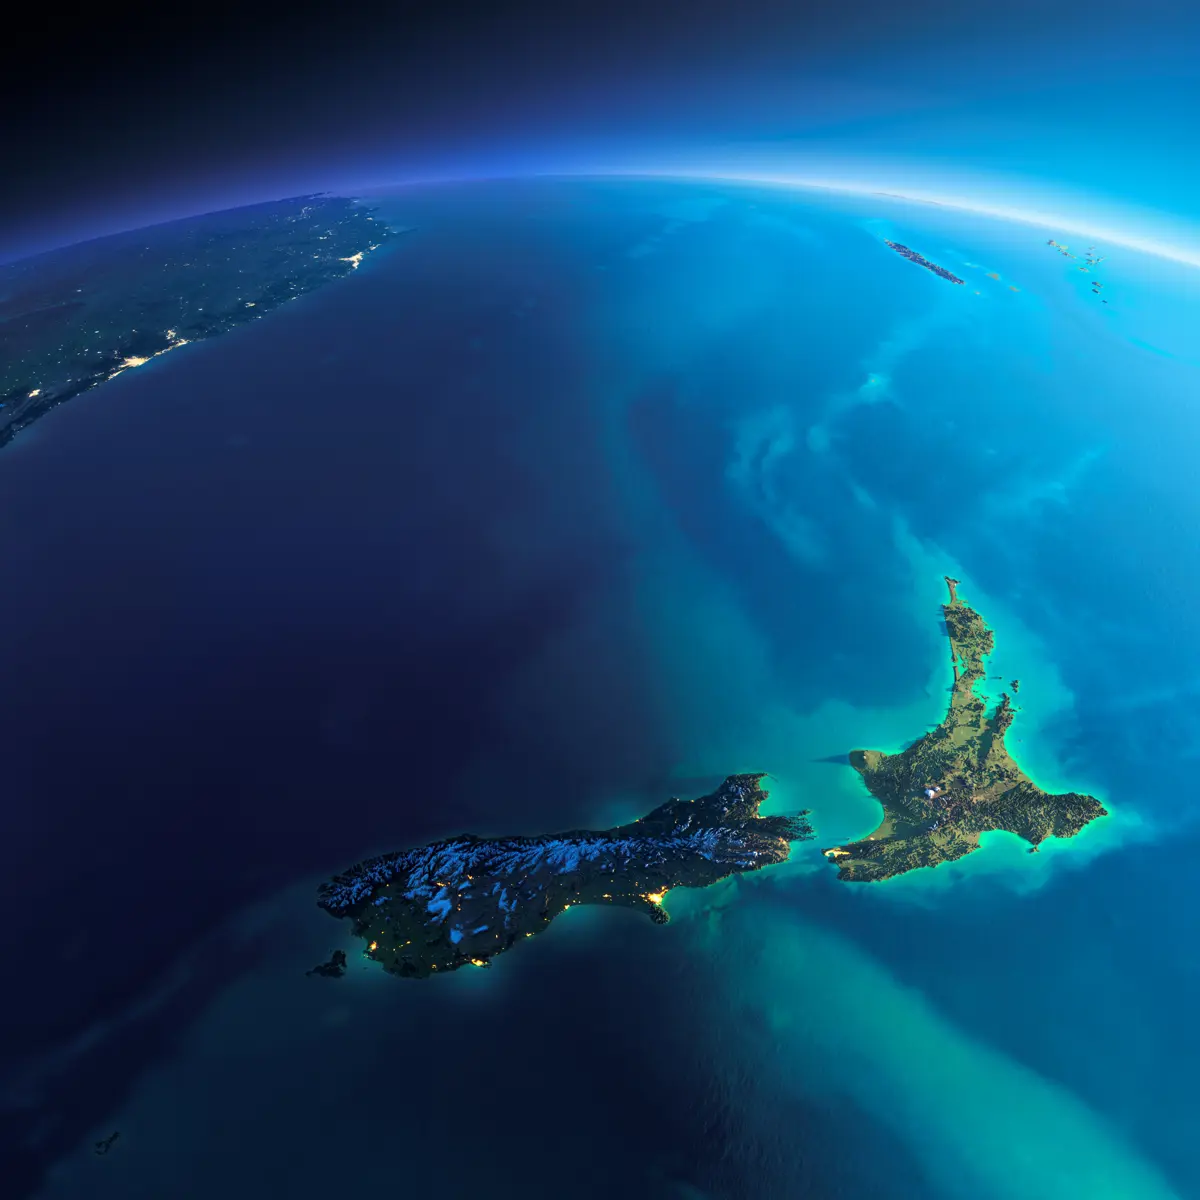
New Zealand Demographics
-
New Zealand is modelled for population demographics for different Representative Concentration Pathways (RCP) for years 2040 and 2100. RCPs are different amounts of greenhouse gas concentrations of 2.6 and 8.5.
The dataset - what is it?
The data set shows regional population changes based on the two climate change scenarios (i.e. at concentrations of 2.6 and 8.5). The current drier regions are more vulnerable to climate change and their populations reduce with higher RCP. Overall, New Zealand shows a reduction in population by the end of this century.
Why it's important
Climate change may have an impact on where people choose to live and work. This data set attempts to predict what changes in population and demographics might look like under different climate change scenarios. This information can be used by land owners and other professionals to help guide decision making processes.
-
-
How to use this information safely
-
Fitness for purpose / limitations
This table indicates whether the dataset is suitable for different types of questions at different scales.
Note: Users should carefully consider their purpose as this dataset may not be suitable.
Operational
Absolute
Relative
Screening/scoping
Block/farm
No
No
No
No
Multi-farms(5+)
No
No
No
No
Catchment
No
No
No
No
National/regional
Yes
Yes
Yes
Yes
-
-
-
Please note:
You can use this information to help form an understanding of potential changes in population and demographics might occur under different climate change scenarios.
Your PDF will download to this device shortly. It can take up to a minute on a slow connection. Please do not close your browser.
Locate and explore different uses for your whenua
Tell us a bit about your whenua and priorities you and your whānau hold. Our tool will present some different uses for your whenua that may help you achieve these.